State of the Restoration Industry 2017
Growth, Trends, & Concerns among Today’s Restoration Contractors

There are changes brewing in the restoration industry today, perhaps unlike any period before. We are seeing an industry divided by program work, fighting to get paid what they feel their work is worth, and a new generation of restorers coming of age and beginning to find their places in the restoration and remediation industry. Technology is exploding; software is paving the path toward ultimate efficiency and mobility for restorers. Our smartphones are just as functional as having a computer on the jobsite. Manufacturers are creating new chemicals, cleaners, and other products that are more effective than before. Some major organizations are going through restructuring, trying to regain lost ground and trust, while old industry standards are being revised and new ones created. And today, we better understand the importance of our relationships not just with customers, but also with adjusters, agents, and others who have a direct impact on our companies.
As R&R has witnessed these trends emerge, we decided it was time to do an in-depth study on the state of the restoration industry. Earlier this spring, BNP’s Market Research Group reached out to more than 10,000 individuals in the restoration and remediation industry to complete an in-depth questionnaire on their business, growth projections, tool and equipment usage, chemical and product preferences and purchases, budgets, thoughts on program work, and more.
The biggest trend we see when analyzing the nearly 40 pages of results are the major differences between franchise and independent companies on various topics. Plus, some very clear trends arose during an open-ended portion of the questionnaire where restorers could say whatever they wanted about trends they’re seeing in program work (TPAs), insurance, mold remediation, working with adjusters, hiring practices, and more.
Breaking it Down
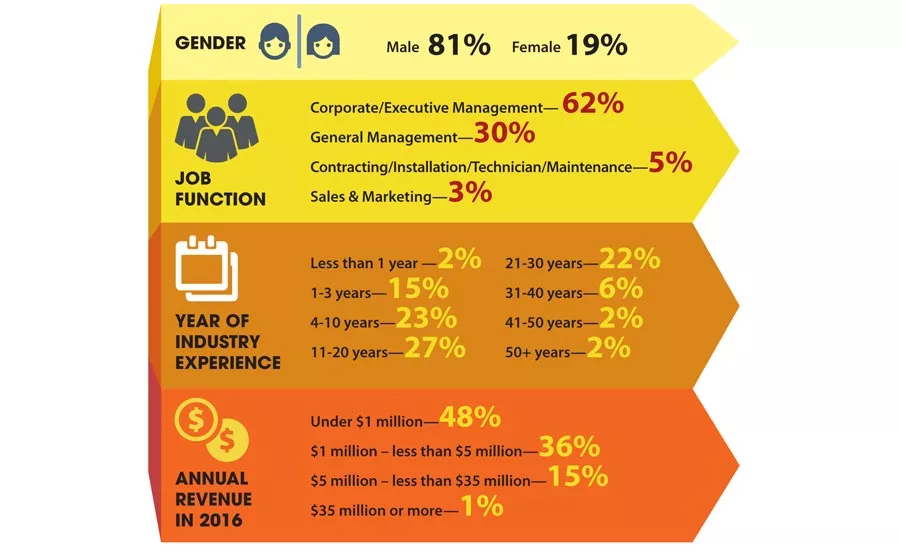
First, let’s take a look at the basics of this study.
Nearly half of the contractors said water damage restoration was their primary business. Fewer than 10 percent do mostly fire, 6 percent do mostly mold remediation, and another 6 percent specifically specialize in indoor environmental quality. Seventeen percent of contractors felt they fell outside those categories, listing things like biohazard and hoarding remediation, asbestos and lead remediation, general contracting, and commercial work as their core business.
On average, two-thirds of the work done by the companies involved is residential, about one quarter commercial, and 4 percent do mostly institutional work like government contracts, hospitals, schools, and so on.
Another breakdown of note: sixty-four percent of those who took the survey are independent contractors; 29 percent are franchisees; the remaining 7 percent are industry consultants or part of some other small niche.
Looking for quick answers on restoration, remediation and cleaning topics?
Try Ask R&R, our new smart AI search tool.
Ask R&R →
Phew, okay, got all that? Let’s move on and start really breaking all of this down to figure out where the industry stands today, and where we might be heading next.
TPA vs. Private Work
Contractors were asked to tell us what percentage of their work is private, and what is program or TPA work. Overall, the contractors reported doing 80 percent private work and 20 percent TPA work. However, below, check out the breakdown of program work for franchise versus independent contractors.
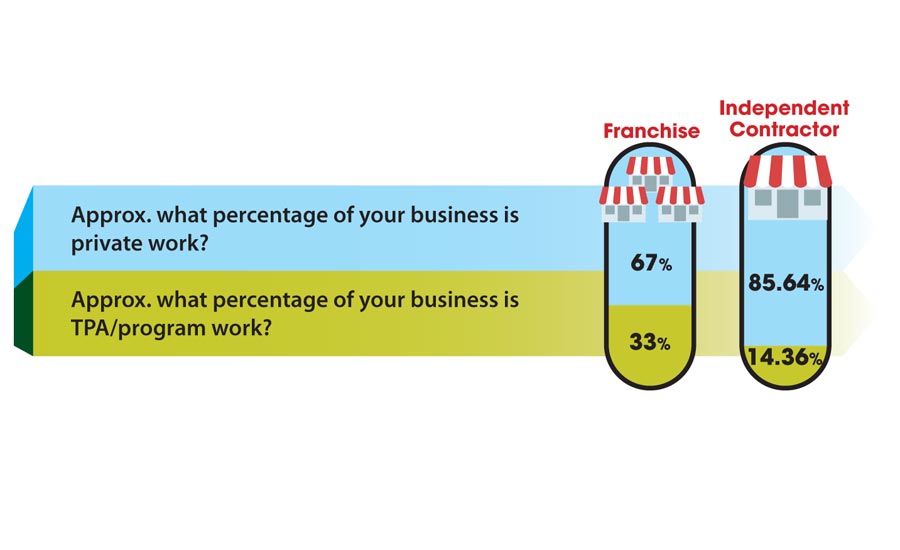
When given the chance to openly comment about trends and concerns, respondents offered simple phrases about TPA work such as, “TPAs implementing tighter restrictions”, “TPAs taking over claims”, and “Increase in TPA fees.”
Hiring & Company Growth
Job breakdown wasn’t the only area where franchise and independent contractors had very different answers. When it comes to hiring, it looks like the independent shops are doing more of it, on average, especially when it comes to subcontractors.
Division aside, growth and hiring overall in the restoration industry are on a good path. In the last year, 38 percent of the companies who responded to this survey said they’ve hired more full time staff. Fifty-four percent reported their full time staff remained the same, and just 8 percent decreased their full time staff. Those numbers stayed pretty consistent for subcontractor and part time hiring as well.
When combing through the results, we were happy to see that three out of four contractors believe their revenue will increase this year, by an average of 28 percent. That’s wonderful news for the industry overall! Just 17 percent of respondents thought their company’s revenue would remain the same this year, and 6 percent expect a decrease in revenue. Again, on this last point, more franchises reported believing their revenue would decrease this year than independent contractors.
Staying on the topic of growth, nearly two-thirds of respondents expect an increase in their commercial and industrial work, and 60 percent expect increased residential jobs to come their way.
Chemical & Equipment Usage
Curious what kind of products and equipment your competition is using? Let’s start with chemicals and other cleaning-type products. According to the responses of some budgeting questions, the average restoration company spends about 22 percent of their budget on chemicals and cleaning products. We gave respondents a list of nine product types, not specific brands of course, and they selected all that apply to their company. Here’s how it turned out:
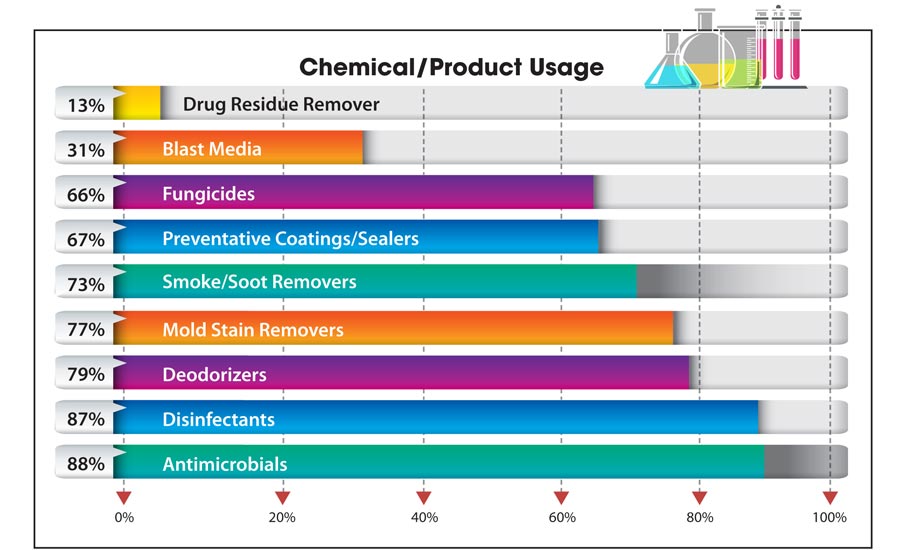
One small, but interesting note about the product usage is that more independent contractors reported using sealers and preventative coatings than franchisees.
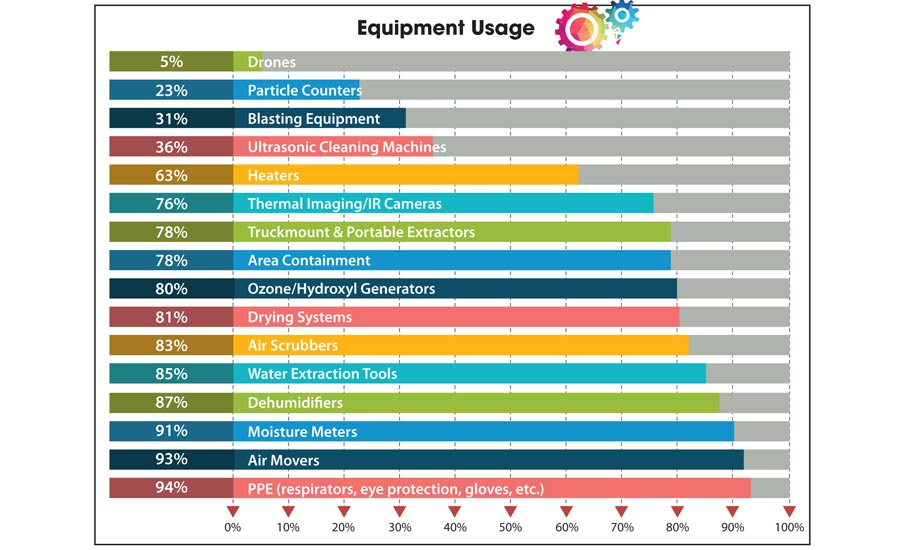
Now, moving on to equipment usage, most of the results likely won’t come as much of a surprise to you. According to this survey, 32 percent of the average restoration company’s budget is spent on equipment every year. Nearly everyone who responded said they use PPE, air movers, and moisture meters. Take a look at how the numbers broke down:
On average, more than half of the tools and equipment purchased by restoration contractors come from a local distributor or supplier, according to this study. Less than 20 percent of purchases are made directly from the manufacturer, and about 16 percent are made from big box home improvement centers. A few companies reported buying some of their equipment online, from sources like Amazon.
And when it comes to making purchasing decisions, product quality/reliability, customer service, and price were among the top three determining factors.
The Challenges Ahead
We talked a little bit about hiring and growth trends earlier, but a large chunk of this survey asked respondents to really dive deep into pressing issues for the restoration industry today. When we asked people to list up to five trends they’re seeing today in the industry, here are the words that prevailed:
- TPA
- Insurance
- Mold
- Competition
- Adjuster
- Employees
Twenty-eight percent of the people who took this survey typed in TPA as a trend they’re seeing, without being prompted. It was nearly that same percentage of people who mentioned insurance, with comments such as, “An inability to satisfy our customers due to overreach of insurance carriers”, and “Insurance companies are trying to fight and pay less for remediation.” There were also comments about insurance companies requiring more and more technology to monitor contractors, and frustrations about getting paid on time and in full for invoices.
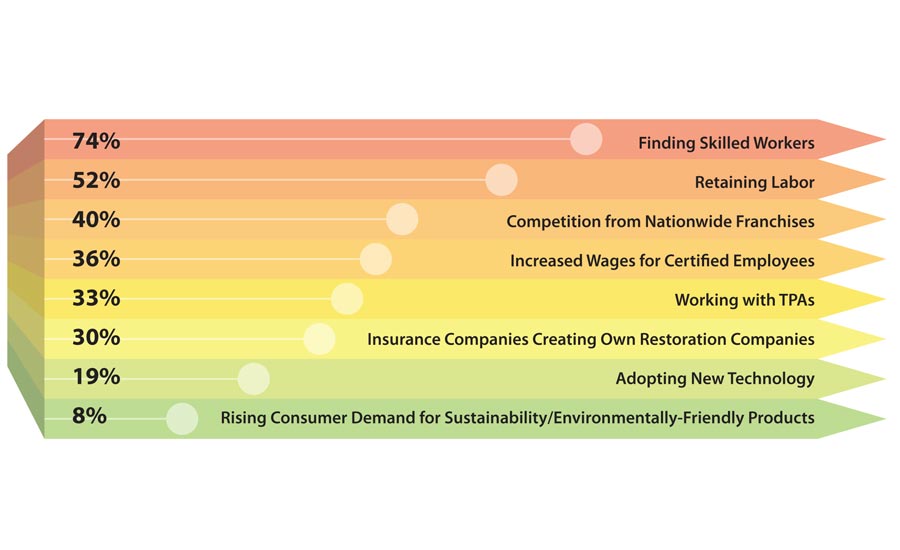
We also asked contractors to talk about their biggest challenges. Unsurprisingly based on other articles in R&R and discussions within the restoration industry, 74 percent said finding skilled workers was their biggest challenge. Retaining labor came in second, with 52 percent voicing that concern. When prompted to pick their three biggest challenges in the next 12 months, here is how people responded:
Tip of the Iceberg
Everything you have read here is really just the tip of the iceberg for this study. We will reference it often in the coming months in other articles in R&R, and hope it helps you make more informed decisions for your restoration company moving forward. The better we understand our industry and the clear trends, the better we can work together to press forward toward effective growth and continued dedication to our customers.
Please visit www.clearmarkettrends.com to purchase and download the entire report as well as access a wide inventory of other studies done in this industry. You can also email us at info@clearmarkettrends.com if you have any questions.
Looking for a reprint of this article?
From high-res PDFs to custom plaques, order your copy today!


-1.gif")